Since its inception, NomadMania has always attempted to make a rational division of the world. Here, we will review the criteria that we use to decide how many regions a country should have and how these have developed across the almost 14 years of NomadMania history.
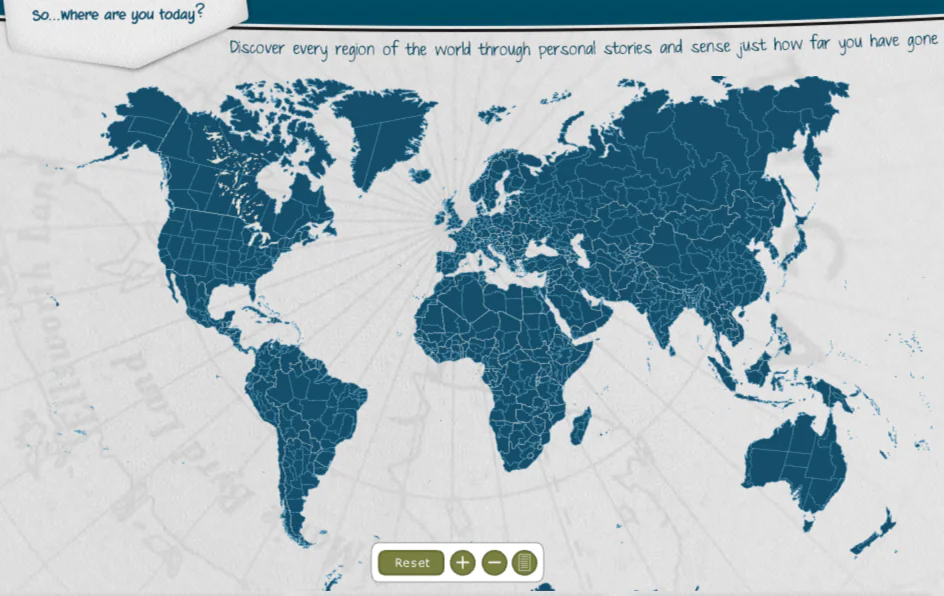
Please note this exercise only refers to the number of regions per country – the precise divisions once the number has been determined are a different issue, usually decided based on a country’s own administrative divisions or sometimes based on geographical or cultural factors.

Beginnings
When the NomadMania list of regions was initially built in 2011, founder Harry Mitsidis and Artur Anuszewski spent a long time deciding what the number of regions per country would be. The world’s largest 9 countries – all with a territory above 2.5 million square kilometers – were split into their administrative regions, which accounted for more than a 1/5 of the whole list. Then obviously territories such as Gibraltar, Aruba etc. had to be considered.
 |
 |
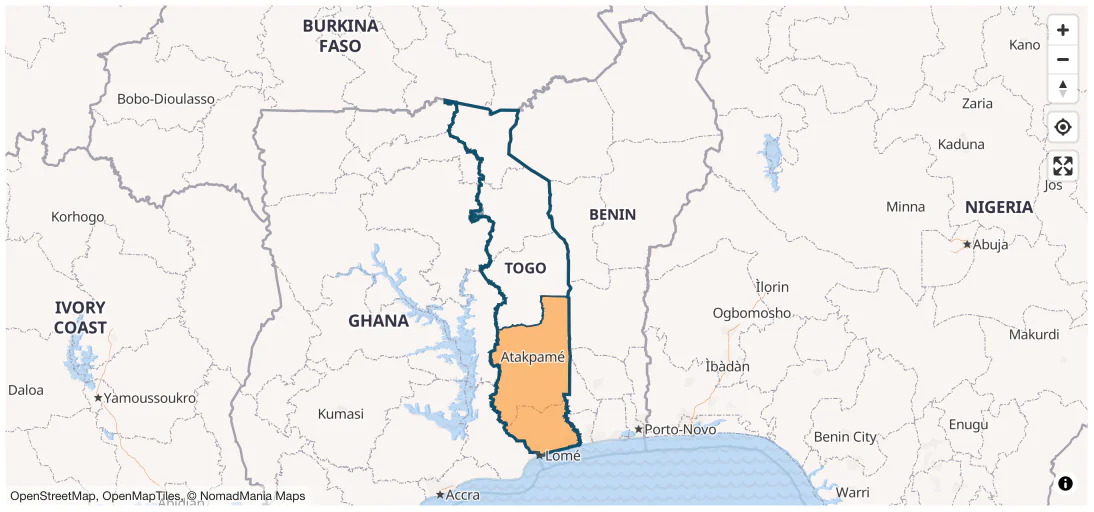
But the biggest innovation at the time, which had never been considered before, was the division of smaller countries into regions, with an attempt to empirically award a logical number per country. Iraq was divided into 5; Guinea into 3; even small countries like Slovenia or Togo were split into two regions. The main idea was that to really discover a country, deeper exploration is almost always needed and warranted.
The Optimal
In the years following, an attempt was made to rationalise the division further. The aim was for the division to be data-driven. And what data would be relevant in terms of a division of a country into regions?
In the initial version of what we called ‘The Optimal’, five interrelated criteria were considered. These have been the main underpinnings of our main regional division until today:
- Territory i.e. size
- Population
- Cultural richness, based on World Heritage Sites and the Ethnic Fractionalisation Index
- Economic prosperity, based on a country’s GDP
- International Tourist Arrivals
The first two criteria were considered more important for the division, given weightings of 30% and 25% respectively, while economic prosperity, relevant and a measure of a country’s overall ‘importance’ perhaps, was only weighted by 10%.

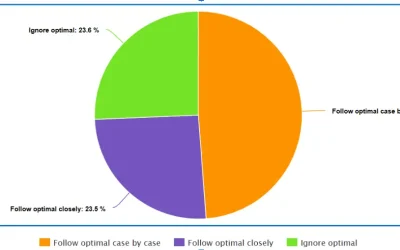
In the first NomadMania Conference at Layang Layang in 2017, the optimal was extensively used to drive the debate for the participants’ subsequent vote into how regions were to be re-allocated into an extended list of regions, which ultimately led to our increase to 1301 regions.
How did the optimal actually work? Each criterion’s score was multiplied by its weighting and a final ‘total’ was revealed, which was taken to be the ‘optimal’, or the ideal number of regions that a country should have out of all the regions in NomadMania.
One Big and one Little Mistake
With the optimal updated with newer data every year – especially as population figures radically changed for some countries, as did tourism numbers – some of the numbers have been changing. However, over time it has become apparent that there were two methodological mistakes in how the initial calculations were conducted, one of them of critical importance.
No allowance was made for a ‘denominator’. In other words, when all the numbers given per country were added up, they lead to the ‘optimal’ out of the total number of ‘optimals’ for the countries rather than the total number of regions that NomadMania is composed of. This ‘optimal’ has been in the past out of approximately 930 regions, instead of 1301. In other words, for many countries the optimal has been under-calculated significantly.
Second, perhaps less of a problem, the number of territories would have to be considered as well – those that ‘have to’ be included in the list, no matter how many regions the ‘optimal’ reveals as necessary. For example, Aruba would have to be included in our list regardless of how many regions the Netherlands – which has sovereignty over it – should have per the ‘optimal.’
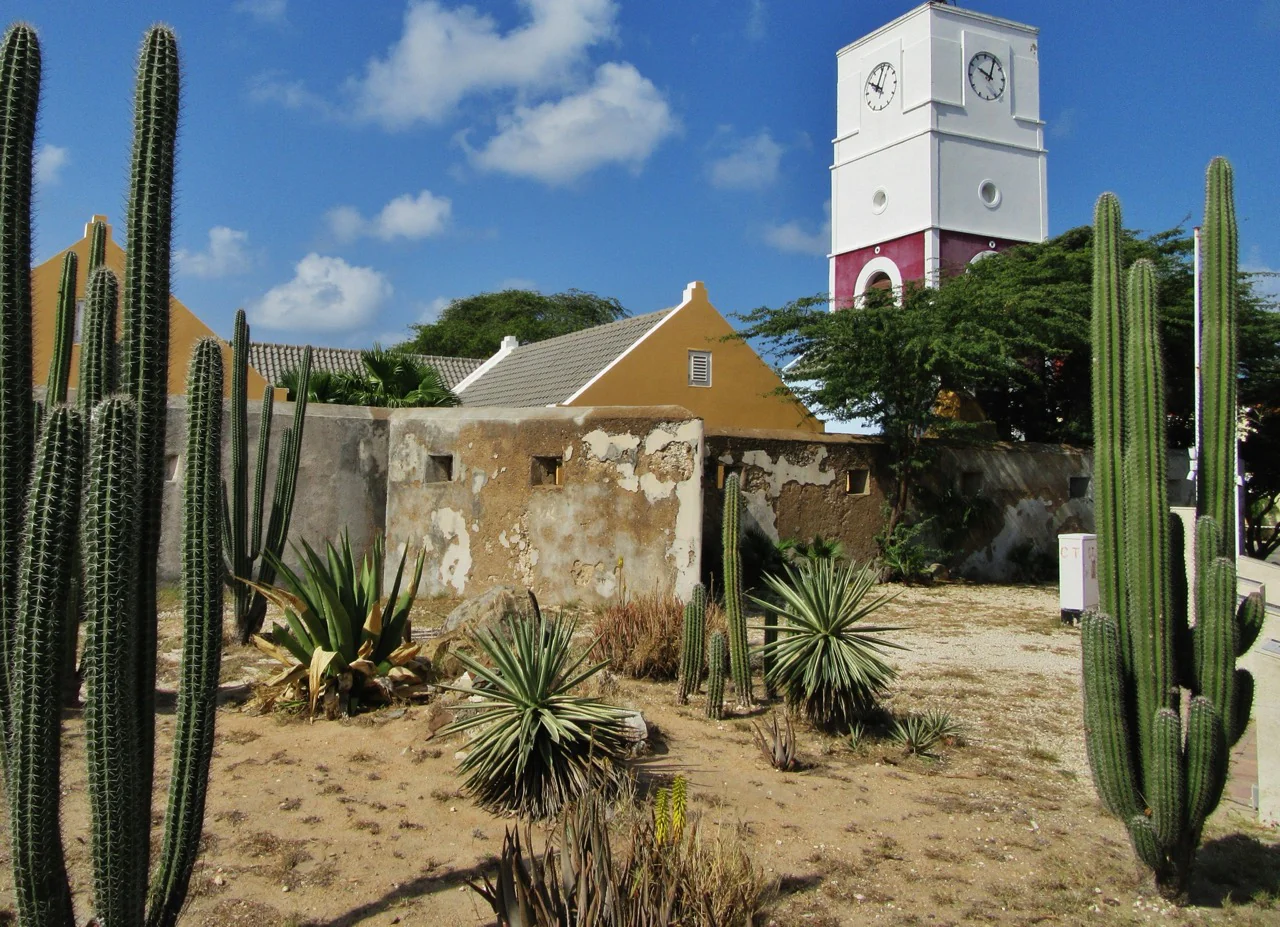
Dutch Fort Zoutman, Oranjestad, Aruba by Gene R Johnson
New considerations
Based on the above mistakes, two important steps have been taken, followed by a crucial third consideration.
First, a list of ‘must have’ regions – mostly territories, or exclaves – has been devised. This list ultimately includes 90 regions (listed at the end of this text) which need to be subtracted from 1301 for a ‘real’ denominator of total possible regional ‘slots’ per country to be determined.
Second, the optimal is now calculated based on this ‘new’ denominator of 1211 (1301-90). So, where the initial ‘total optimal’ was out of 930 regions (with the criteria below this becomes 1018), it is then recalculated to fit 1211, thereby being an accurate measure of the ideal number of regions per country.
Third, renewed importance has been given to the issue of the criteria for the optimal and their weightings, as this has never been done in a formal, systematic way before. To settle this issue definitively in a way which can be seen as representative but also valid, this task was entrusted to our Executive Committee which is composed of 12 extremely diverse travellers representing different nationalities, ages and travel styles. The Executive has deliberated extensively on all the possible criteria and allocated weightings as a compromise for the different opinions of its esteemed members.

It is these ‘new’ criteria, decided on by the Executive, along with the new ‘weightings’, also decided by the Executive, that we will present below. The data for each of these criteria is used to calculate the new ‘correct’ optimal, which reveals the ‘ideal’ total regions out of the denominator of 1211 (1301-90 ‘must have’ regions).
Renewed Criteria for Current Optimal Calculation
Following the work of NomadMania’s Executive Committee, here are the criteria for the ‘new’ optimal and their assigned weightings:
- Geography – weighted at 35%
– Size of a country – 15%
– Geographic Diversity Index -15%
– Biodiversity Index – 5% - People and Culture – weighted at 35%
– Population – 15%
– World Heritage Sites – 10%
– Number of Languages Spoken – 5%
– Ethnic Fractionalisation Index – 5% - History and Governance – weighted at 20%
– GDP nominal – 5%
– History and Governance Index – 10%
– Human Development Index – 5% - Popularity – weighted at 10%
– International Tourist arrivals – 5%
– Accessibility – 5%
…
1) Geography – weighted at 35%
Three elements make up Geography, two of them never considered before.
1.1) Size of a country – weighted at 15%.
This is extremely straight-forward and the data is taken based on the widely available numbers. The data should be well-known to travellers, with Russia and Canada as the world’s largest countries and Monaco as the smallest.
Note that for countries with more than 30% desert, we have (always) lowered the size numbers by 25%. The reasoning here is that, impressive though desert may be, an endless expanse of desert will still yield no Series items and very little additional experience for the traveller.
1.2) Geographic Diversity Index – weighted at 15%
This is an Index created by NomadMania with a minimum value of 0 and a maximum of 11. The index considers not the size of a country, but its geographic diversity, with each of the following criteria ‘awarded’ 1 for a possible total of 11
- Sea
- Mountains above 1.500 meters
- Mountains above 3.500 meters
- Desert
- Islands (more than 20 of a certain significance)
- Inhabited islands (more than 20 which are inhabited)
- Lakes (more than 20 of a certain size)
- Jungle
- Extreme weather variations (at the same moment)
- Glaciers
- Notable Valleys
To give an indication of the ‘highs’ and ‘lows’ – China, India and Mexico end up with a 10, whereas conversely a number of countries score 0 including, for example, Burkina Faso and Czechia.
1.3) Biodiversity Index – weighted at 5%
This considers diversity in terms of fauna and flora, which has also been deemed relevant for the traveller experience. The data for this comes from this source: theswiftest.com/biodiversity-index/.
Brazil and Indonesia top this list, while San Marino gets the lowest rating.
2) People and Culture – weighted at 35%
Four elements make up this category, one of them never considered before, as follows:
2.1) Population – weighted at 15%.
This is purely numerical, considering the number of people who live in a country. This is obviously very dynamic criterion, especially for some parts of the world where population is increasing at a very fast pace, so an effort has been made to not only look at current data but also at projections for the next decade and beyond.
India and China are outliers with very high numbers, with Nauru and Tuvalu the world’s least populated countries.
2.2) World Heritage Sites – weighted at 10%.
The numbers change here every year, and we look at the total number per country, whether the sites are shared with other countries or not. Italy and China currently have the most WHS, with a number of countries so far having none.
2.3) Number of Languages Spoken – weighted at 5%.
This is a new criterion within this section, considered for the very first time as relevant. This data is taken from the following source, with one decimal off for ease of calculation. Papua New Guinea has the most languages, at 840.
You can find the data here: https://en.wikipedia.org/wiki/List_of_countries_by_number_of_languages
2.4) Ethnic Fractionalisation Index – weighted at 5%.
This measure may be very imperfect methodologically and also a little outdated, but it is still the best measure we could find to measure diversity within a country. In this index, Liberia has the highest rating, whereas North and South Korea both score at the bottom.
The scores can be found – first column – here: https://en.wikipedia.org/wiki/List_of_countries_by_ethnic_and_cultural_diversity_level
3) History and Governance – weighted at 20%
Three elements make up this category, two of them ‘new’, as follows:
3.1) GDP nominal – weighted at 5%.
These are the official figures which also change annually and indicate the overall wealth (and therefore, to a large extent, influence) of a country. The USA and China have by far the highest values here, with a host of mainly African countries at the other end.
You can find a list of nominal GDP here: https://en.wikipedia.org/wiki/List_of_countries_by_GDP_(nominal)
3.2) History and Governance Index – weighted at 10%.
This novel index from 0 to 10 has been created by NomadMania in an attempt to measure the stability and continuity of a country by scoring it across 4 criteria:
- Years since Independence. A score of 3 is given for a country older than 100 years, 1 for a country older than 50 years, 0 for countries younger than 50.
- Stability of borders. A score of 3 given for a country with the same border for more than 100 years, 1 for a country with the same border for more than 50 years.
- Lack of war. A score of 2 is given for a country not involved in a war for more than 100 years, 1 for a country not involved in a war for 50 years or more. Recently independent countries which have not seen war are awarded a 1 even if they have not been independent for a full 50 years.
- Rule of law governance. A score of 2 is given for generally stable, democratic regimes for more than 100 years, with 1 for countries with such regimes for more than 50 years. ‘Younger’ countries cannot score on this measure, so are at a disadvantage.
It has been especially interesting creating this scale, which will be presented at a later date in full. Andorra, Liechtenstein, Sweden and Switzerland get a full score of 10; a large number of countries have a total score of 0, mainly more recently independent ones which also saw violence in their effort to gain their independence.
3.3) Human Development Index – weighted at 5%.
This data comes from official sources. However, because the actual Index has values between 0.97 and 0.41, we have decided to re-scale it with scores of 10 (for scores of 0.95 and above on HDI) to 0 (for scores below 0.45 on HDI). Iceland tops the latest list, with South Sudan at the other end.
The HDI is available here: https://en.wikipedia.org/wiki/Human_Development_Index
4) Popularity – weighted at 10%
4.1) International Tourist arrivals – weighted at 5%.
The data for this is often very difficult to get and sometimes even conflicting, but we have tried to cross-check as much as possible. We award a 1 for each 1 million tourist arrivals. France and Spain top this list; Nauru, Tuvalu or Kiribati are said to be the world’s least visited countries.
4.2) Accessibility – weighted at 5%.
This criterion was proposed by the Committee to ‘reward’ countries that make themselves accessible. We will use an adapted version of Henley’s Passport Welcome scores, creating an index between 0-10. Samoa and Micronesia score a 10 with their visa-free for all policies; conversely North Korea, Afghanistan and Turkmenistan, which require complex visas from all, score a 0 in this category.
The data is found at the link below, but we have adapted to allow for some specific situations – Kenya for example, requires pre-registration and payment, so it is not ‘visa free’ as stated in the scale, and our score reflects this.
https://www.passportindex.org/byWelcomingRank.php
Nevertheless, we plan to change the calculation of this last criterion by creating a NomadMania ‘Friendliness and Accessibility Index’ based on responses by our own community. Stay tuned for this very interesting poll which will ultimately have an effect on the optimal!
Process
Once the numbers for each of the 12 criteria are researched and tabulated, they are entered into a calculation and, magic, a total (Total) appears. This total then needs to be accorded based on our desired number of regions (currently 1301), so that each country gets an allocated number from the total that we would like to have. That is, 1301 minus what we call ‘essential’ regions which would have to be split anyway based on geopolitical criteria regardless of the ‘optimal’ – in general territories and autonomous areas (Guadeloupe, Hong Kong, Galapagos, Cabinda etc.)
And so, we get the optimal. But then the human factor comes, as we will often diverge from this. We will not be splitting San Marino into regions even though its optimal is above 2… while we do give Micronesia 4 regions when its optimal is much lower.
Afghanistan Example
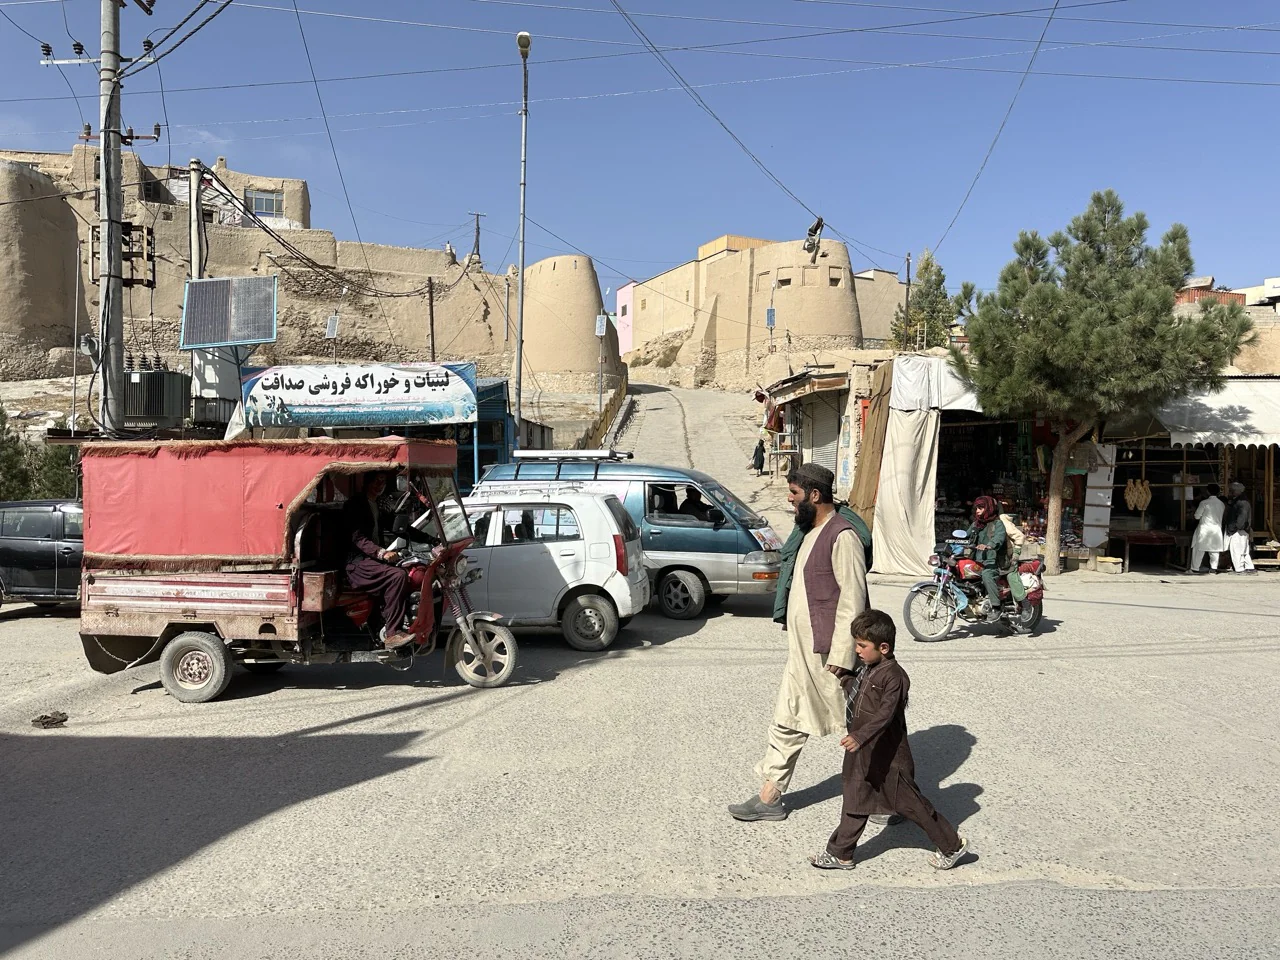
by Orest Zub
As an example, we are giving you below all the scores for Afghanistan, which is alphabetically our first listed country.
| Size | GDI | Bio | Popul. | WHS | Lang | EFI | GDP | HGI | HDI | ITA | AC | Total | T1301 | |
| 15% | 15% | 5% | 15% | 10% | 5% | 5% | 5% | 10% | 5% | 5% | 5% | |||
| 4.89 | 6 | 6.1 | 4.4 | 2 | 4.1 | 7.69 | 0.18 | 6 | 1 | 0.01 | 0 | 4.05 | 4.81 | |
Afghanistan has the following scores:
- A territory of 489,000 km2
- A GDI score of 6 (Mountains above 1500, Mountains above 3500, Desert, Weather Variation, Glaciers, Notable Valleys)
- Biodiversity: 6.1
- Population of 44 million
- World Heritage Sites: 2
- Languages Spoken: 41
- Ethnic Fractionalisation Index: 7.69
- GDP: 18 million
- History and Governance Index: 6 (3 for being older than 100 years – independent in 1919 – and 3 for having the same stable borders for more than 100 years)
- Human Development Index developed into our own scale: 1 (its actual score is 0.48)
- International Tourist Arrivals: Less than 100,000, so 0.01
- Accessibility: 0
The final ‘optimal’ for Afghanistan after crunching in the numbers is 4.81 regions. Given that Afghanistan is split into 5 regions in NomadMania, it would appear that we have it right for Afghanistan in terms of the number of regions.
And that’s how we do it for every one of the countries!
Appendix
Below find the list of what we deem are ‘essential’ regions – even if we didn’t use the optimal, we would need to list these regions separately as they are significantly different either politically or geographically.
| Cabinda | AO | |
| Norfolk Island | AU | |
| Christmas Is. | AU | |
| Cocos Is. | AU | |
| Nakhchivan | AZ | |
| Easter Island | CL | |
| Hong Kong | CN | |
| Macao | CN | |
| San Andres | CO | |
| Faroe Islands | DK | |
| Greenland | DK | x3 |
| Bornholm | DK | |
| Galapagos | EC | |
| Ceuta | ES | |
| Canary Islands | ES | x2 |
| Melilla | ES | |
| Aland Islands | FI | |
| St. Pierre & Miquelon | FR | |
| Guadeloupe | FR | |
| Martinique | FR | |
| French Guiana | FR | x2 |
| French Polynesia | FR | x5 |
| Reunion | FR | |
| Mayotte | FR | |
| New Caledonia | FR | x2 |
| St. Barts | FR | |
| St. Martin | FR | |
| Wallis and Futuna | FR | |
| TAAF | FR | |
| Isle of Man | GB | |
| Jersey | GB | |
| Guernsey | GB | |
| Gibraltar | GB | |
| Ascension | GB | |
| St Helena | GB | |
| Tristan da Cunha | GB | |
| Falklands | GB | |
| Montserrat | GB | |
| Anguilla | GB | |
| Turks and Caicos | GB | |
| Cayman Islands | GB | |
| Bermuda | GB | |
| Pitcairn | GB | |
| Shetlands | GB | |
| Orkneys | GB | |
| South Georgia | GB | |
| Abkhazia | GE | |
| South Ossetia | GE | |
| Athos | GR | |
| Andaman Is. | IN | |
| Lakshadweep | IN | |
| Iraqi Kurdistan | IQ | |
| Transnistria | MD | |
| Gagauzia | MD | |
| Aruba | NL | |
| Bonaire | NL | |
| Curacao | NL | |
| St Maarten | NL | |
| Saba | NL | |
| St Eustatius | NL | |
| Svalbard | NO | |
| Azores | PT | |
| Madeira | PT | |
| Kaliningrad | RU | |
| Visby | SE | |
| Oecussi | TL | |
| Crimea | UA | |
| Puerto Rico | US | |
| American Samoa | US | |
| Guam | US | |
| Northern Mariana | US | |
| US Virgin Is. | US | |
| Vatican | VT | |
| Cook Is | NZ | |
| Tokelau | NZ | |
| Niue | NZ |
.
There are 85 here, plus an additional 5 divisions of Antarctica which we feel are justified based on the significance and size of the continent.